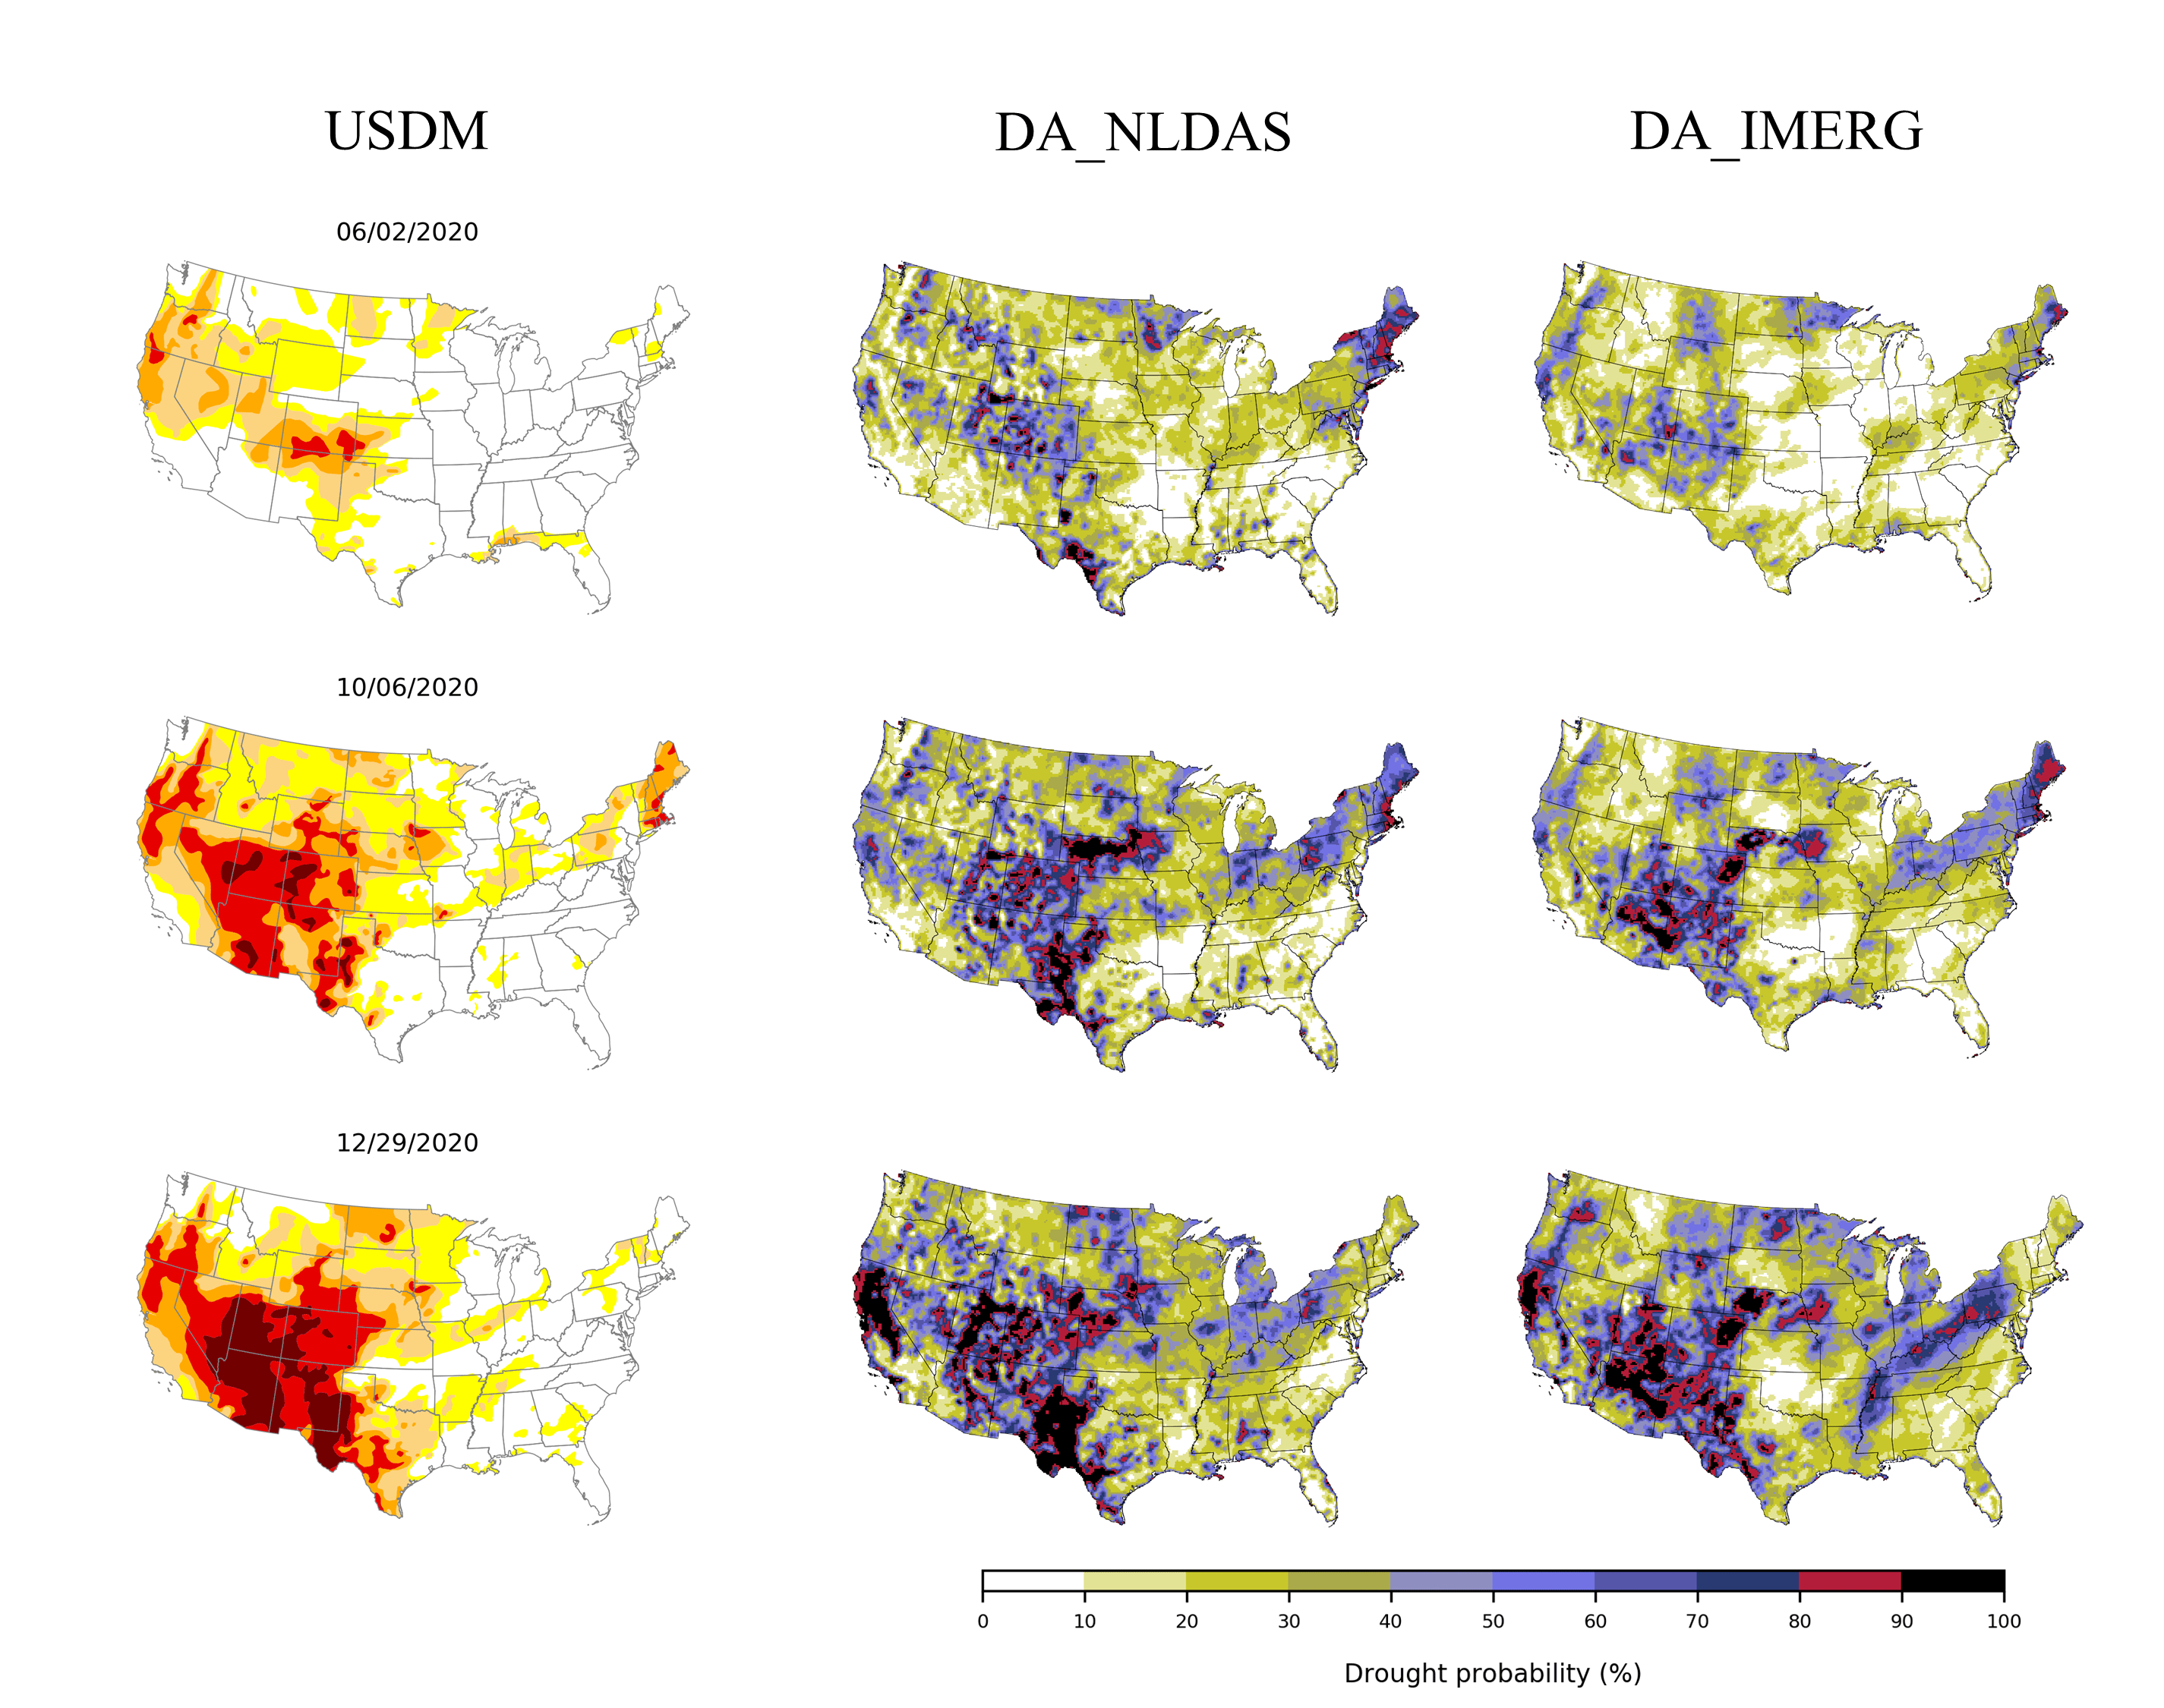
Droughts are among the costliest natural hazards that occur annually worldwide. Their socioeconomic impacts are significant and widespread, affecting the sustainable development of human societies. This study investigates the influence of different forcing precipitation data in driving Land Surface Models (LSMs) and characterizing drought conditions. Here, we utilize our recently developed LSM data assimilation system for probabilistically monitoring drought over the Contiguous United States (CONUS). The Noah-MP LSM model is forced with two widely used precipitation data including IMERG (Integrated Multi-satellitE Retrievals for GPM) and NLDAS (North American Land Data Assimilation System). Soil moisture and evapotranspiration are known to have a strong relationship in the land-atmospheric interaction processes. Unlike other studies that attempted the individual assimilation of these variables, here we propose a multivariate data assimilation framework. Therefore, in both modeling scenarios, the data assimilation approach is used to integrate remotely sensed MODIS (Moderate Resolution Imaging Spectroradiometer) evapotranspiration and SMAP (Soil Moisture Active Passive) soil moisture observations into the Noah-MP LSM. The results of this study indicate that the source of precipitation data has a significant impact on the performance of LSM data assimilation system for drought monitoring. The findings revealed that NLDAS and IMERG precipitation can result in a significant difference in identifying drought severity depending on the region and time of the year. Furthermore, our analysis indicates that regardless of the precipitation forcing data product used in the land surface data assimilation system, our modeling framework can effectively detect the drought impacts on crop yield. Additionally, we calculated the drought probability based on the ensemble of soil moisture percentiles and found that there exist temporal and spatial discrepancies in drought probability maps generated from the NLDAS and IMERG precipitation forcings… Read more